Watching Hamburg play football is not fun. Especially when you are a fan of the club.
The most devastating part is that whenever you believe there is a point of change, a sign of potential, a glimmer of hope for the future, somebody is going to mess up.
It’s pretty much the same as staying together with somebody who already cheated on you 3 times. Right now everything is looking alright, but deep down in your heart you know you are going to get disappointed again.
Countless coaches were sacked, countless approaches tried. Even the structure of the whole club was changed, but nobody could ever prevent Gideon Jung from tripping over his own feet in the penalty box.
But how do you capture that? How can one explain with data that Gotoku Sakai might be an average passer, but will always lose the ball exactly in the moments where he absolutely should not.
Conventional approaches might want to look at completed passes, chances of the opponents and distance covered as sign of engagement and quality of play. I’m pretty sure that all these stats already give you a good enough sense of Hamburgs’ downfall, but it does not go deep enough.
(In)Secure Passing is a metric that is supposed to capture that. The general idea is to not only look at passing ability, but also to include some measure of risk for each pass.
Doing this we can check which players are either very strong at making the right decisions in high-risk situations or who you would rather not pass the ball to when it matters.
If you are interested in the approach and methodology, you will find that in the next few paragraphs.
If you are only interested in knowing who you should never pass the ball to around your own penalty box, click here.
Approach
To summarise the idea: We want to know, which players regularly lose the ball at the worst possible moments and which players you can give the ball to under pressure.
At first, it seems like a rather easy problem to solve.
Whoever watches the majority of their favourite clubs’ games will already know who they do not want to handle the ball deep in your own half. On the other hand when you think about who you want to give the ball to, there are players who would jump instantly into your mind, players you would trust.
Assessing Risk
To explore this with the help of data requires several steps.
To start off we need to assess which areas are the worst to lose the ball in and how can we numerically define risk?
Luckily we have some data to calculate risk. Using Opta Event data over the last two seasons in the big European leagues we look at each loss of the ball and check, whether the opponent got a shot off in their subsequent possession.

Looking at the graph we are not surprised. The worst possible areas to lose the ball in is right in front of your goal.
Before you kill me for wasting the last 5 minutes of your time, it does get more interesting. The risk scale (on the right hand side) is in terms of probability of the opponent getting a shot off following a loss of possession. We therefore see for passes that are from almost the goal line (and less than 15 meters of distance) that about a third will end up in your opponent taking a shot at your goal.
We don’t only have this information now for the immediate area around the goal, but for every part of the pitch, which lets us assess the risk of every pass in the dataset and therefore check which players lose the ball in the worst possible moments.
Pass Difficulty
Knowing how risky it is to lose a ball in a certain position is not enough, though. Defenders will be heavily favoured, because they are constantly in high risk situations, but have very easy passes to play most of the time (in Hamburg you usually only play it back to the goalie or to the opponent). This would lead us to say they don’t create risk, since most of their passes are successful even in high risk situations.
Therefore a second model had to be built to categorise all passes into easier or harder passes. The way the model works is, that it spits out probabilities for each pass to be successful. Passes backwards to the goalie usually have a success rate of around 99% to be successful.
Combining the probability of a pass being unsuccessful and the risk of losing the ball, we can calculate the Expected Risk of each pass in the dataset.
Expected Risk
As an example we can look at a pass played from right in front of the penalty box (x: 18, y=50), which has a risk of about 21% of leading to a shot of the opponent if played unsuccessfully. However it’s an easy pass to the other center defender with no pressure from the opponent, giving it a success probability of 90%.
We therefore have an expected risk of that specific pass of (1-0.9)*0.21 = 0.021.
A 10% chance of losing the ball with the pass, which would lead to a shot by the opponent with probability of 21%.
In other words, when the pass is played there is a 2.1% chance of the opponent getting the ball and getting a shot at your goal.
Avoided Risk
Going from Expected Risk per pass to an assessment of a players ability over a season to make the right decisions and passes in high-risk situations is another small step.
First let me introduce the idea of avoided risk:
Every time a player makes a pass successfully in a high risk situation we will count that towards his ability to avoid risk for his team. When he loses the ball unexpectedly though, we will count that as caused risk against him.
Avoided Risk = Expected Risk - Caused Risk
Over a full season we therefore just aggregate his avoided and caused risk to see whether he performs above or below average (e.g. how we would expect the average player to perform).
The caused risk can be thought of as “the realised risk”. When you make an unsuccessful pass, the risk of that pass is realised, giving it a caused risk of xx%.
Please note that the caused risk will be zero for every pass that reached a teammate. If a pass is unsuccessful, it is heavily dependent on the difficulty of the pass how much the caused risk exceeds the expected risk, since
Expected Risk = Prob. unsuccessful pass * risk in that area
If for a certain player the Avoided Risk equals 0, he was bang on average. He created as much risk for his team as we would expect him to create, based on the difficulty of his passes and the areas of the pitch he played in.
A positive value would mean he was above average, securing the ball in situations we did not expect him to keep it in. Another way to interpret this is that on average, he is preventing the opponent from shooting by keeping possession.
If the avoided risk is negative, the player is below average when it comes to secure passing. He creates more risk for his own team or in other words gives the opponent more opportunity to shoot due to him losing possession.
Who can you trust?
Using avoided risk aggregated over a full season, we can look at the players who are the best and worst at keeping the ball in the most important situations.
As an example, we will for now look at the last season in the first league for Hamburg. All plots and results for the other European Leagues of this 2018/2019 season will follow after.
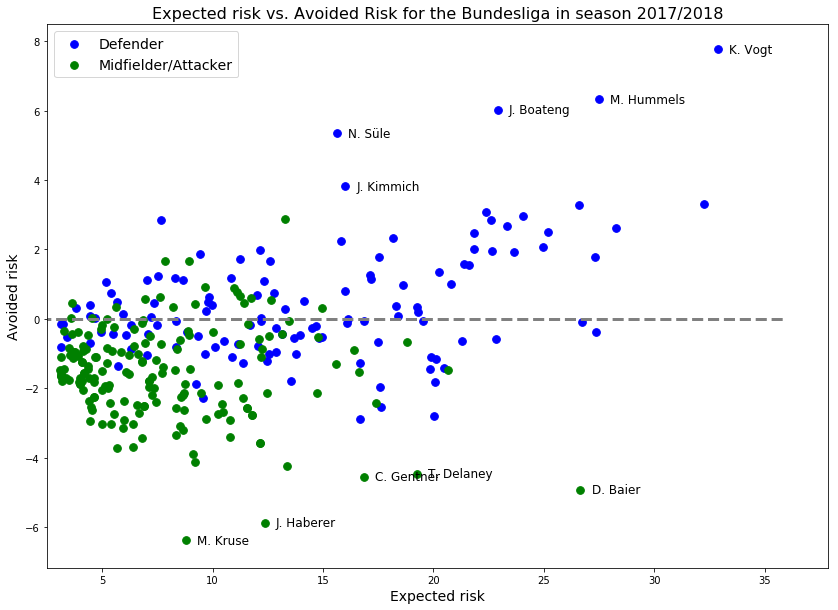
As we can see, defenders are still heavily favoured. Mostly because they are in more high-risk situations and therefore automatically have more chances to increase their absolute number of avoided risk. Since it would be unfair to compare between positions then, we split by Defenders and Midfielder/Attackers in the following plots.

We can see that in this season Kevin Vogt was the coolest when it came to high pressure situations. Not only thanks to his ability in the build-up play Vogt was made captain of TSG Hoffenheim and doubling his market value in the season (before a drop-off in the following season).
Trailing behind him is the complete Bayern Munich defence, led by Mats Hummels.
The worst of all players according to this metric, was Hamburg’s captain Gotoku Sakai. Although Benjamin Henrichs might have been a strong contestant for most insecure passer, had he played more minutes in that season. His ratio of avoided risk to expected risk is a whopping -24%. In comparison Sakai’s proportional risk value is “only” at about -17.5%. Arguably Henrichs might have stabilised, while Sakai does not really have any arguments on his side.
A team-captain that creates a fifth more shot opportunities for your opponent due to his careless passing, might have played a vital role in getting a club relegated for the first time in its 130+ years of club history.
Also, it’s making me go bald.

For Midfielders/Attackers we see that in absolute avoided risk, Hasebe is the strongest, while Thiago is actually posting very similar numbers when looking at the ratio between Avoided and Expected Risk. An impression that gets amplified looking at the results of the 2018/2019 season, in which Thiago is far and away the best player amongst Midfielders/Attackers and even makes it in the Top 5 of overall players in the Bundesliga.
All the Plots for the Bundesliga, Premier League, Serie A and La Liga can be found below (click to enlarge). There are lots of interesting results and also many players we might have expected to be on top.


Looking at these plots gives us an idea of how to rank the players. But what do the values actually mean in terms of shots created?
To explain this a bit better, let’s look at the Top (and Flop) 5 players of this season in the Premier league.
| Player | Created Risk | Expected Risk | Avoided Risk | Risk Proportion |
| A. Laporte | 16.82 | 27.01 | 10.18 | 38% |
| A. Rüdiger | 17.58 | 25.75 | 8.17 | 32% |
| V. van Dijk | 26.42 | 34.47 | 8.05 | 23% |
| T. Alderweireld | 23.68 | 30.19 | 6.50 | 22% |
| David Luiz | 24.87 | 31.29 | 6.42 | 21% |
| S. Bamba | 13.60 | 11.85 | -1.75 | -15% |
| P. van Aanholt | 19.05 | 17.21 | -1.84 | -11% |
| C. Chambers | 24.23 | 22.19 | -2.04 | -9% |
| J. Bednarek | 22.51 | 19.57 | -2.94 | -15% |
| B. Chilwell | 25.78 | 22.80 | -2.97 | -13% |
The strongest (positive) outlier in terms of risk proportion is A. Laporte.
In 35 games, Laporte created about 17 shot opportunities for the opponent due to unsuccessful passing.
A rather impressive number, considering that we would have expected him to create about 27 shots for the opponent.
On the bottom of the list in terms of absolute numbers we find Ben Chilwell, who actually created more chances for the opponent (similarly to Sakai in the earlier example).
In terms of proportional risk created however, Jan Bednarek is even worse.
If Laporte took care of the ball in the way Bednarek did (i.e. not), he would have created about 31.5 shots for Manchester Citys opponents this season.
This makes a difference of 15 shots. A remarkable amount considering that this metric is looking solely at the players’ passing ability, which of course is just a small aspect of what a good defender needs to be able to do.
Hamburg’s passing ability under pressure
Now it gets grim.
This whole blogpost was inspired by Hamburgs’ inability to keep the ball in situations when it matters. Having seen them perform over the 2017/2018 season, I already expected the results for the team to be quite bad.
The following table was still a surprise.
| Player | Created Risk | Expected Risk | Avoided Risk | Risk Proportion |
| F. Kostic | 11.88 | 8.68 | -3.20 | -37% |
| G. Sakai | 19.57 | 16.67 | -2.90 | -17% |
| A. Hunt | 12.58 | 9.69 | -2.89 | -30% |
| A. Hahn | 6.89 | 4.63 | -2.27 | -49% |
| A. Ekdal | 9.44 | 7.25 | -2.19 | -30% |
| Walace | 8.91 | 7.12 | -1.78 | -25% |
| R. van Drongelen | 12.68 | 11.40 | -1.28 | -11% |
| G. Jung | 17.98 | 16.70 | -1.28 | -8% |
| Douglas Santos | 20.98 | 19.89 | -1.09 | -5% |
| M. Steinmann | 5.76 | 4.67 | -1.09 | -23% |
| L. Holtby | 6.83 | 5.87 | -0.97 | -16% |
| B. Wood | 4.70 | 3.74 | -0.96 | -26% |
| M. Mavraj | 14.25 | 13.70 | -0.55 | -4% |
| D. Diekmeier | 14.41 | 13.95 | -0.46 | -3% |
| K. Papadopoulos | 26.82 | 26.71 | -0.11 | 0% |
| J. Pollersbeck | 15.45 | 15.58 | 0.14 | 1% |
| C. Mathenia | 26.60 | 27.58 | 0.98 | 4% |
Overall of all 18 players that played enough minutes to be considered, we have TWO that actually created a little bit less risk than we would have expected. Two players that were better than average…those two players are unfortunately the two goalkeepers on the roster.
Beside all defenders being in the negative (in a metric that favours defenders), seeing that the first options for the central midfield Walace and Ekdal creating respectively 25% and 30% more shot opportunities for the opponent is shocking.
For my own sake I don’t want to go through player by player (wtf André Hahn?), since the overall picture is already quite depressing.
It’s more important to see that the metric is able to catch how badly Hamburg struggled across all positions to keep the ball.
Even though they obviously had lots of other trouble (like scoring only 18 goals in the first 26 games of the season), this gives us numerical evidence that being unable to maintain the ball in high-risk situations made their battle to stave off relegation much harder and more importantly made it nerve-wracking to watch them play football, especially as a fan of the club.

One thought on “Secure Passing”