On this blog there have been multiple entries that were mostly focused on passing. Starting off by designing a metric that showcases how bad Hamburg’s players are in keeping the ball, then moving on to using a metric to show how bad Hamburg’s players are at creating chances, we will now keep now look at the general passing ability of the teams in Europe, instead of looking at metrics for individual players.
Even more importantly we will try to characterise the playing style of the teams instead of having to rank players from good to bad.
Approach: Finding teams that play similar
The goal is to cluster together teams that show similar behaviour in various passing metrics.
In one group we want to find teams that are very comparable to each other in passing behaviour, while between groups there should be a noticeable distinction.
Since this is mainly a football blog with the goal of understanding the beautiful game a bit more by using data, we won’t go into too much detail here which algorithms we used and how exactly they work. I am very happy to discuss this though with anybody interested.
For now the most important part is that we are looking for teams that are very similar to each other to form groups, while these groups are distinctly different from each other.
Which already opens up a whole new question:
What do we measure?
There are a lot of ways to measure passing ability, especially in a team.
The nice part that distinguishes this approach from previous blog articles is that we don’t need a ranking. Frankly we don’t care whether one team does subjectively better in a certain category than another. We are only looking for teams that behave similar to others and therefore only need sensible features in our model that catch how a team plays.
Here are the features I came up with:
- Duration of the possession: How long (in seconds) is the average possession of a team. How long are they able to keep the ball before they lose it again?
- Length of possession: Average number of stations that are involved in one possession.
- Players Involved: The number of average players involved in a possession. Obviously highly correlated to the length of possession as well as the duration of the possession, but it might make a difference for some teams
- Pass Count: The average number of passes per game over the season
- Proportion of passes played in the last third: A percentage that gives the ratio of how many of a teams’ passes came in the last third of the pitch
- Pass accuracy: Overall pass accuracy all over the pitch
- Pass accuracy in each third: No need to explain more really, but interesting from a modelling perspective because we might see teams that are holding the ball for a long time in the first 2 thirds, but then whenever they get the ball in the last third they are becoming less accurate
Results
Using the previously described features we can now look at a teams performance per season.
The following table are the an example of a sample we might feed into the algorithm:
| Team | du- ration | pos length | avg. player | pass count | t3 prop | pass acc | t3 acc | t2 acc | t1 acc |
| Inter Milan | 14.05 | 5.87 | 3.85 | 600.84 | 24% | 83% | 69% | 88% | 85% |
| HSV | 9.77 | 4.20 | 3.03 | 445.59 | 21% | 72% | 63% | 76% | 70% |
Inter Milan was picked pretty much randomly. HSV (Hamburger SV) was picked to show you once again what I went through over the last few years.
We are looking here at the 2017/2018 season metrics for both clubs, where Milano finished 4th in the league, while Hamburg got relegated.
We see significant differences between both teams. Generally Milan was able to hold the ball for longer;
- on average their possession lasted about 14 seconds, compared to almost 10 seconds for Hamburg
- their possession usually went through almost 6 stations (in other words we observe on average 5 passes in the possession), while in Hamburg it’s closer to 4
- for Inter there was almost one player more involved on average in each possession
Moreover their pass accuracy is significantly higher than that of Hamburg, while also more of their passes, although by a small margin, are happening in the last third.
Instead of only 2 samples, we had overall 156 samples to group together.
While trying to make the clusters as homogenous as possible and ending up with distinct groups I found that (subjectively) 4 groups gives me the best and most meaningful results.
Below you can find a heatmap of how each cluster stacks up in the different categories.
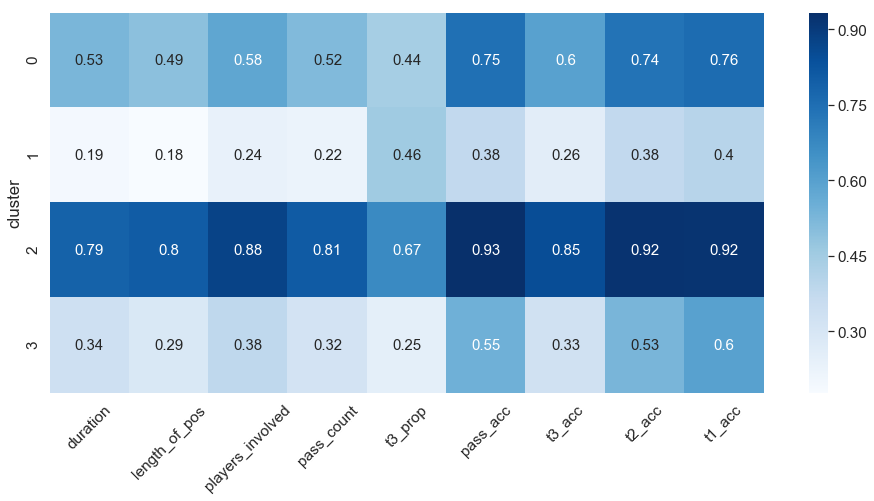
The values are normalised, meaning the highest possible value is 1 while the lowest is 0. We then calculate the average per category for each cluster and end up with the above graphic. If a tile in the heatmap is at 0.5, the teams in the respective cluster would be clustered around the mean in that category.
We immediately see that cluster 2 is the Elite Passing group. In all categories these teams are stronger, whether it is about the duration of the possession, the numbers of passes played or the accuracy.
They are able to keep a possession and play precise passes in all areas of the pitch.
Cluster 0 in my opinion could be labeled the ambitious teams, playing nice football but not quite in the elite group yet.
Cluster 1 and 3 looks significantly different from the others. To be honest, Cluster 1 looks pretty abysmal, which is also the label we will give those teams for now.
While cluster 3 also struggles a lot when it comes to accuracy in the last third of the pitch, they are otherwise pretty average in the accuracy department. They are also able to better to hold the ball then teams in Cluster 1. Interesting to note is that teams in the first cluster play way fewer passes in the last third than any other cluster. This might suggest that we are looking at teams here that are mostly passing it around in their back, which might also explain their higher than average overall accuracy, but then try to move the ball quickly into the last third and often lose it there.
To sum this stuff up, here is how we’ll name the clusters and how many teams we find in each:
Cluster 0: Ambitious Teams – 42 teams
Cluster 1: Abysmal Passing Teams – 37 teams
Cluster 2: Elite Passing Teams – 16 teams
Cluster 3: Afraid of the last third Teams – 61 teams
Per team (unless they got relegated) we have two samples, which means that in the Elite Passing cluster we will not necessarily have 16 distinct teams, since some teams might have made the cluster in both seasons.
Visual representations of passing abilities
To get a better picture of how well separated the clusters are we can plot the teams against some features.
From the heatmap we already know what to expect in the different categories.
First we can check how it looks when accounting for number of passes played per game and the pass accuracy.

The clustering seems to work quite well. Getafe CF and Cardiff are both in the “Abysmal Passing” cluster, while not being able to get even 2 out of 3 passes to a teammate.
In the Elite Passing group we see teams we would expect like Manchester City and FC Barcelona. Liverpool looks like a toss-up in this plot between the Ambitious Passing and the Elite Passing group, while Atletico Madrid on the other hand is looking quite weak when only controlling for pass accuracy and the number of passes played per game.
Since we only showcase two features of the model here, there might be other reasons why Liverpool and/or Atlético a part of one instead of another cluster.

We can see the same phenomenon when checking for the proportion of passes in the last third against the average number of passes per game.
Here it is especially interesting to see the “Afraid of the last third” group, since they are generally okay in terms of passing accuracy, but fail to get into the last third.
we see that a majority of the pink points play 20% or less of their passes in the last third. While teams who are found in the “Abysmal Passing” group are mostly above that threshold, with the exception of Parma.
Caveats of this approach: Maybe a bit too technical.
Even though I don’t want to go into too much detail and rather keep it light I feel that it’s important to quickly state, that there are some things to bear in mind about this approach.
You can skip this part of the article if the technical details are not as interesting to you.
The approach behind the clustering is a simple k-means algorithm. Using highly correlated features, such as the accuracy in different parts of the pitch or the duration in seconds of a possession versus the average number of involved players, can put additional weight on certain underlying factors.
The proportion of passes in the last third for example is a very interesting feature, but its weight is probably underappreciated here, since we have multiple features describing accuracy and length of possession.
The original approach was to keep track of all metrics that I thought are interesting and throw them in the model. However it might be more sensible to either to a PCA and use the factors to cluster or throw highly correlated features out. This way we might also see a stronger impact of the proportion of passes in the last third, while now the clusters are mostly defined by passing accuracy and length of possession.
Who are the Elite Passing teams?
Overall in 2 years, only 10 teams made it in the Elite-Passing cluster. 6 Teams were able to repeat, being able to consistently pass the ball well over two seasons:
- SSC Napoli
- FC Barcelona
- Bayern Munich
- Juventus FC
- Manchester City
- Real Madrid
Then we have 4 teams that floated in and out of that group.
Borussia Dortmund was good, but not elite in Tuchel’s last season. With Favre playing amazing-to-watch football (especially in the first half of the season) they managed to move in that group this year.
Similarly Sarri managed to get Chelsea in the top group, a squad that arguably had problems last season but stabilised in terms of passing.
Arsenal dropped out of that group in Emerys first season.
The last and only team, that is not considered a big European club is Betis Sevilla, who managed to excel at passing in the past season, moving into the group of Elite Passing teams.
Teams with the biggest change in passing ability
Looking at teams who were able to stay in the Elite Passing group over two seasons made me think that it might be interesting as well to check out teams that showed the biggest difference from one to the next season.
| Season | duration (in sec.) | pos_ length | avg. player | pass count | t3 prop | pass acc |
| 2017 | 9.94 | 4.27 | 3.05 | 417 | 25% | 73% |
| 2018 | 13.97 | 5.63 | 3.74 | 528 | 21% | 82% |
The table above is from the past two seasons of Sassuolo Calcio. There seems to be a huge improvement from 2017/18 to the 2018/19 in terms of passing. The accuracy jumped up by 9%, they keep the ball for longer, involve more players and overall play more passes per game.
This improvements moved them from the cluster of “Abysmal Passing” to “Ambitious Passing”. Once again, I am pretty unfamiliar with the Serie A, which led me to googling their coaching history and jump to a conclusion:
I would assume that Coach Roberto De Zerbi, who started at the beginning of last season, had a big impact on their playing style.
Unfortunately that change in passing ability did not have any influence on their rank in the league at the end of the season. In 2017/2018 they finished 11th, as they did in the following season, with exactly the same amount of points.
However in 2018/2019 they managed to score 24 goals more, leading at least to a vastly improved goal difference under De Zerbi.
I would also argue, just from looking at the numbers, that the last season was way more enjoyable to watch as a Sassuolo fan.
The full Top 5 in terms of biggest change from one season to the next are:
1. US Sassuolo Calcio
2. Rasen Ballsport Leipzig
3. Chelsea FC
4. Leicester City
5. Real Sociedad
All of these 5 teams improved, with the exception of Real Sociedad. Since Sassuolos change from one season to the next is by far the most noticeable, I would love if somebody could find a follower of the club, to tell me whether this analysis seems adequate or whether you (and me too) have wasted your time by reading this article.
